
Тригонометрические преобразования синуса и косинуса
Узнайте, как амплитуда, период, фазовый сдвиг и вертикальный сдвиг изменяют графики синуса и косинуса для точного тригонометрического моделирования.
Учебные Ресурсы
Этот контент является частью открытой библиотеки обучения Mathos AI. Разработан для помощи студентам в визуализации и понимании сложных математических задач.


Problem
Create a video about trigonometric transformations with sound.
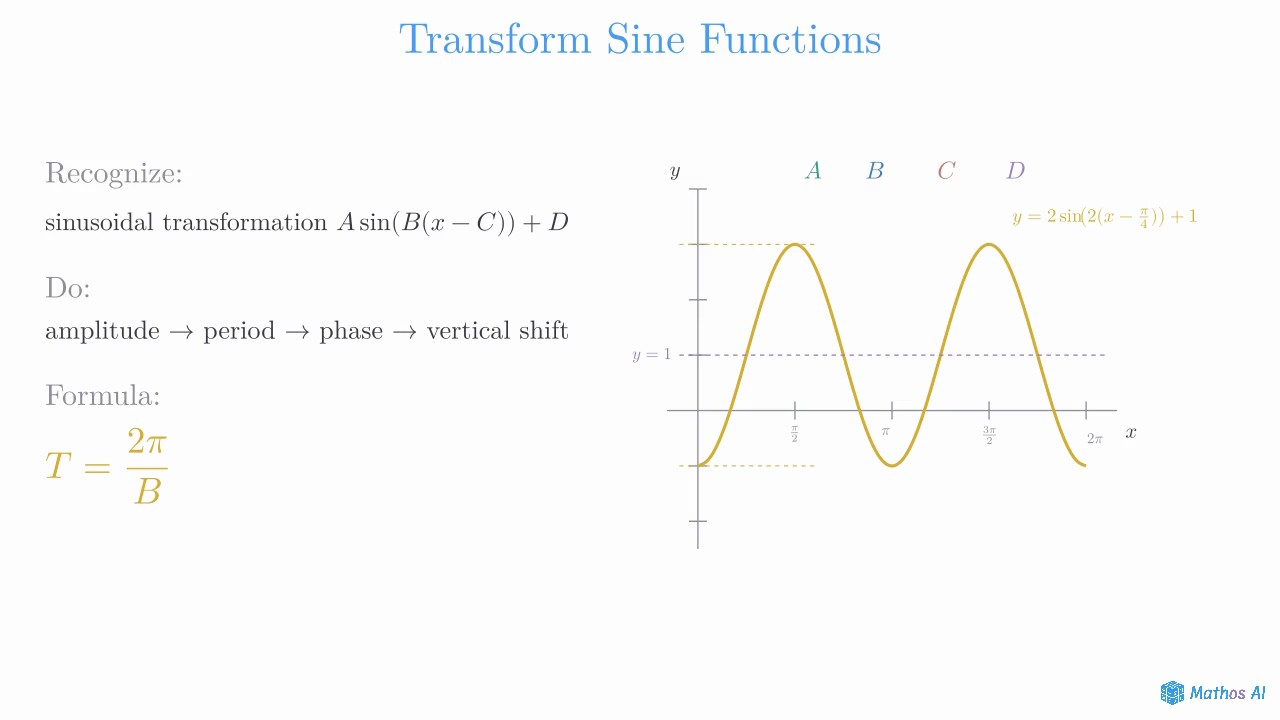
Step 1: Identify the Transformation Parameters
To transform a trigonometric function like
first identify the parameters.
The value changes the amplitude, adjusts the period, shifts the graph horizontally, and moves it vertically.
By applying these values sequentially, you can graph any periodic function accurately.
Понятия
Graphs of Trigonometric Functions
The graphs of , , and , and how amplitude, period, phase shift, and midline change with the general form .
Sinusoidal Modeling
Using sine or cosine functions to model periodic real-world phenomena such as temperature cycles, tides, and circular motion. Determine the amplitude, period, phase shift, and midline from the data.
Function Transformations
A unified framework for transforming any function's graph: horizontal and vertical shifts, reflections over the axes, and horizontal and vertical stretches/compressions. The order of transformations matters.
Ещё видео
© 2026 Mathos. Все права защищены