
Преобразования графиков синуса и косинуса
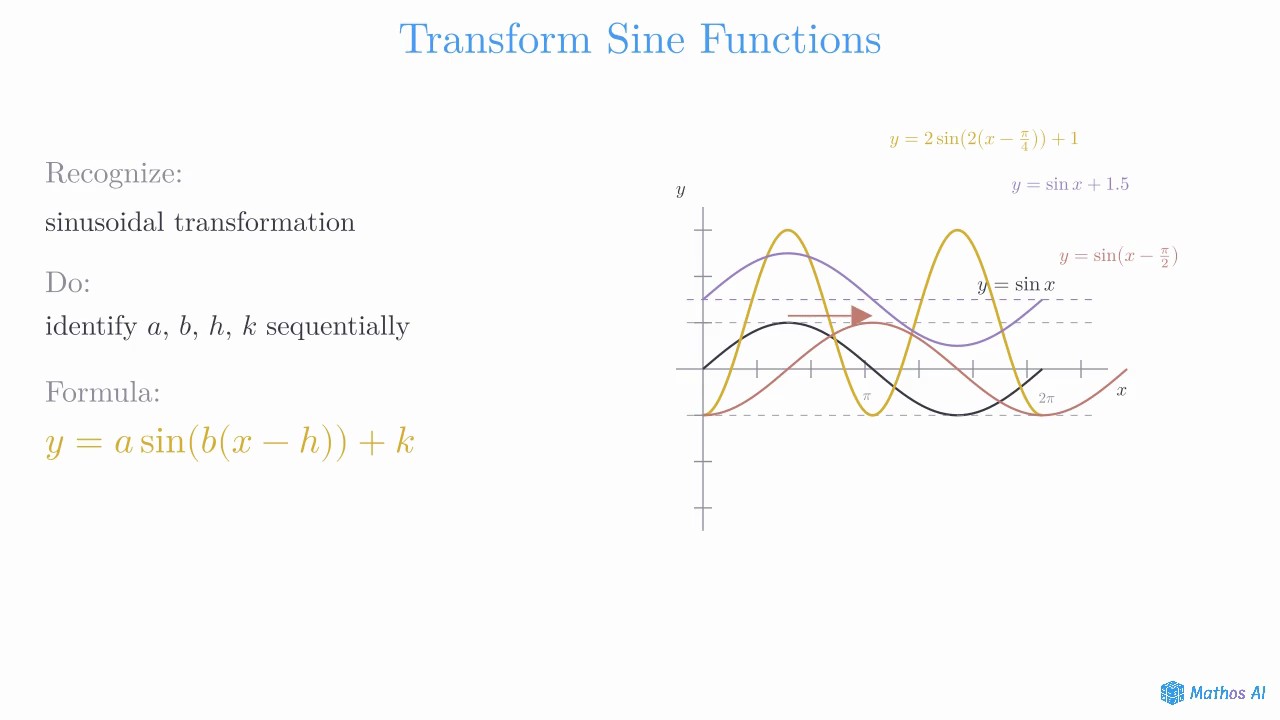
Узнайте, как амплитуда, период, фазовый сдвиг и вертикальный сдвиг изменяют графики синуса и косинуса в форме y = A sin(B(x - C)) + D.
Учебные Ресурсы
Этот контент является частью открытой библиотеки обучения Mathos AI. Разработан для помощи студентам в визуализации и понимании сложных математических задач.


Problem
Create a video about trigonometric transformations.
Step 1: Identify the General Form
A transformed sine function can be written as
Each parameter changes the graph in a specific way.
Step 2: Adjust the Amplitude and Period
The value of controls the amplitude of the graph. The amplitude is
The value of controls the period. For a sine function, the period is
Step 3: Apply the Shifts
The value of creates a horizontal phase shift. The graph shifts horizontally by .
The value of creates a vertical shift. The graph shifts up or down by .
Step 4: Final Result
By adjusting the amplitude with , the period with , the horizontal phase shift with , and the vertical shift with , you can accurately graph any transformed trigonometric function of the form
Понятия
Graphs of Trigonometric Functions
The graphs of , , and , and how amplitude, period, phase shift, and midline change with the general form .
Function Transformations
A unified framework for transforming any function's graph: horizontal and vertical shifts, reflections over the axes, and horizontal and vertical stretches/compressions. The order of transformations matters.
Ещё видео
© 2026 Mathos. Все права защищены