
Sinüs ve Kosinüs Grafik Dönüşümleri
Y = A sin(B(x - C)) + D biçimini kullanarak genlik, periyot, faz kayması ve düşey kaymanın sinüs ve kosinüs grafiklerini nasıl değiştirdiğini öğrenin.
Öğrenme Kaynakları
Bu içerik, Mathos AI açık öğrenme kütüphanesinin bir parçasıdır. Öğrencilerin karmaşık matematiksel problemleri görselleştirmelerine ve anlamalarına yardımcı olmak için tasarlanmıştır.


Problem
Create a video about trigonometric transformations.
Step 1: Identify the General Form
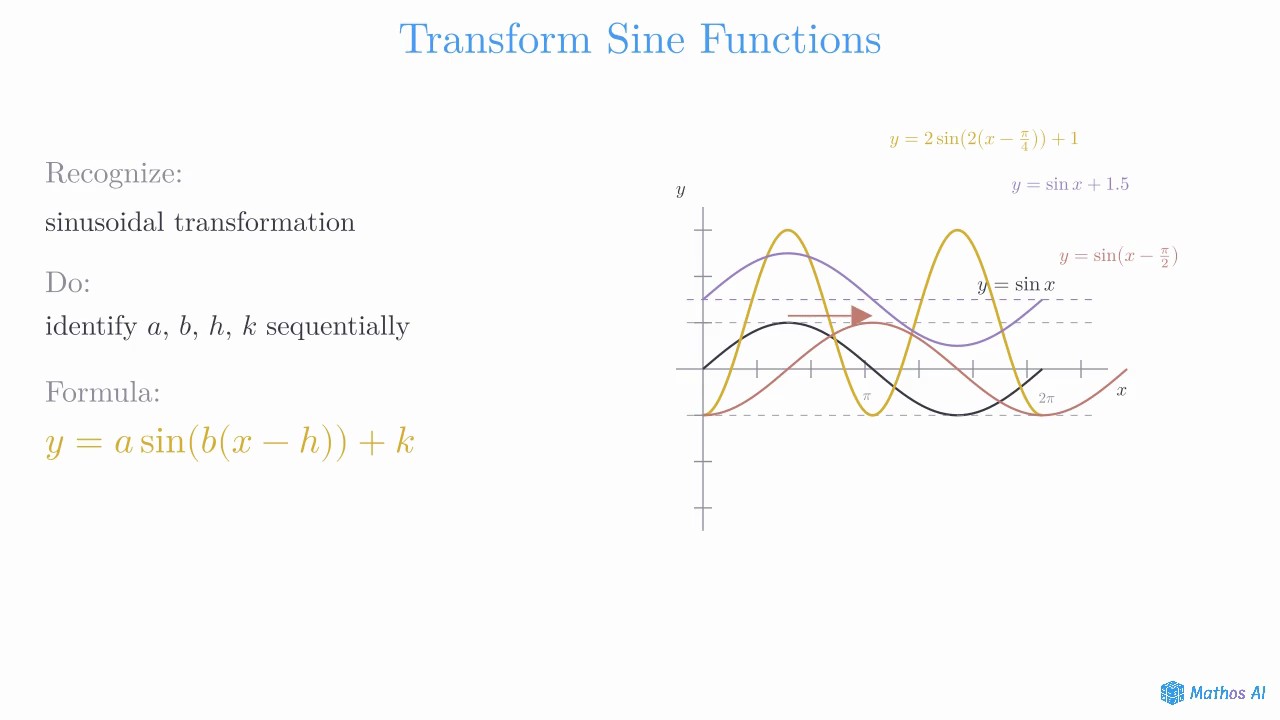
A transformed sine function can be written as
Each parameter changes the graph in a specific way.
Step 2: Adjust the Amplitude and Period
The value of controls the amplitude of the graph. The amplitude is
The value of controls the period. For a sine function, the period is
Step 3: Apply the Shifts
The value of creates a horizontal phase shift. The graph shifts horizontally by .
The value of creates a vertical shift. The graph shifts up or down by .
Step 4: Final Result
By adjusting the amplitude with , the period with , the horizontal phase shift with , and the vertical shift with , you can accurately graph any transformed trigonometric function of the form
Kavramlar
Graphs of Trigonometric Functions
The graphs of , , and , and how amplitude, period, phase shift, and midline change with the general form .
Function Transformations
A unified framework for transforming any function's graph: horizontal and vertical shifts, reflections over the axes, and horizontal and vertical stretches/compressions. The order of transformations matters.
Daha fazla video
© 2026 Mathos. Tüm hakları saklıdır