Everything You Should Know About AP Statistics
Wednesday, February 12, 2025

AP Statistics is a college-level high school course offered by the College Board's AP Program, introducing students to the major concepts and tools for collecting, analyzing, and drawing conclusions from data. AP Statistics is one of the most useful AP courses because it teaches skills that apply to many fields, like business, science, and social studies. It even helps with everyday decision-making, unlike other AP math courses like AP Calculus, which focuses more on theoretical mathematics.
Whether you're preparing for the AP exam or just want to know more about the course before enrolling, you'll find all the important information about AP Statistics in this comprehensive guide without unnecessary fluff.
Is AP Statistics hard? What is the course all about? Why should you take AP Statistics? Let's find out.
AP Statistics Course Overview
AP Statistics is all about understanding data and making sense of the numbers around us. The course is built around real-world applications, critical thinking, and using tools like graphing calculators and statistical software to break down information.
The AP Statistics curriculum is divided into 9 units. These units break down the key ideas of statistics and prepare students for the AP exam.
| Unit | Exam Weighting (Multiple-Choice Section) |
|---|---|
| Unit 1: Exploring One-Variable Data | 15%–23% |
| Unit 2: Exploring Two-Variable Data | 5%–7% |
| Unit 3: Collecting Data | 12%–15% |
| Unit 4: Probability, Random Variables, and Probability Distributions | 10%–20% |
| Unit 5: Sampling Distributions | 7%–12% |
| Unit 6: Inference for Categorical Data: Proportions | 12%–15% |
| Unit 7: Inference for Quantitative Data: Means | 10%–18% |
| Unit 8: Inference for Categorical Data: Chi-Square | 2%–5% |
| Unit 9: Inference for Quantitative Data: Slopes | 2%–5% |
Throughout the AP Statistics course, you'll also learn and develop four essential skills: Selecting/Collecting Data, Data Analysis, Probability & Simulation, and Statistical Inference.
- Selecting & Collecting Data: Good data starts with good collection methods. You’ll learn how to design surveys, choose samples, and run experiments that actually produce useful results.
Imagine you want to study the average screen time of teenagers in your city. You could use cluster sampling by dividing schools into clusters based on location, randomly selecting a few clusters, and surveying all the students in those schools to collect data.
- Data Analysis: Numbers are just numbers until you make sense of them. You’ll explore different ways to summarize and visualize data, looking for trends, patterns, and outliers.
Let's say you surveyed 100 students about their favorite social media platform. You could create a bar chart to visualize the number of students who prefer Instagram, TikTok, or Snapchat to find out which platform is more popular.
- Probability & Simulation: Since we can’t predict the future, probability helps us make the best guess. You’ll work with probability models and simulations to understand randomness and likelihood.
For example, if you want to estimate the probability of rolling a 6 on a die and flipping heads on a coin simultaneously. You could simulate this by rolling a die and flipping a coin 100 times, then calculating the proportion of times both events occur together (e.g., 6 and heads).
- Statistical Inference: Use sample data to make conclusions about an entire population by estimating an unknown parameter (a value that describes the population, like the true mean or proportion).
For example, if your school claims students sleep an average of 7 hours per night (the parameter), you can use a sample of students’ sleep data to test whether this claim is accurate and make decisions based on the results.
Now let's look at a practical example using these essential skills in AP Statistics.
For example, you want to test if using an AI math tutor like Mathos AI improves students' AP Statistics exam scores. Here's what you can do:
- Step 1: Design the study. Randomly assign 50 students to try Mathos AI as a study tool for one month, and another 50 students to study using traditional methods. This ensures a fair comparison between the two groups.
- Step 2: Collect data. After one month, all 100 students take a practice AP Statistics exam. Record their scores for analysis.
- Step 3: Analyze the scores (data). Calculate the average exam score for both groups. For example, if the group that used Mathos AI averages 85 and the traditional group averages 80, you perform a two-sample test to determine if this difference is statistically significant.
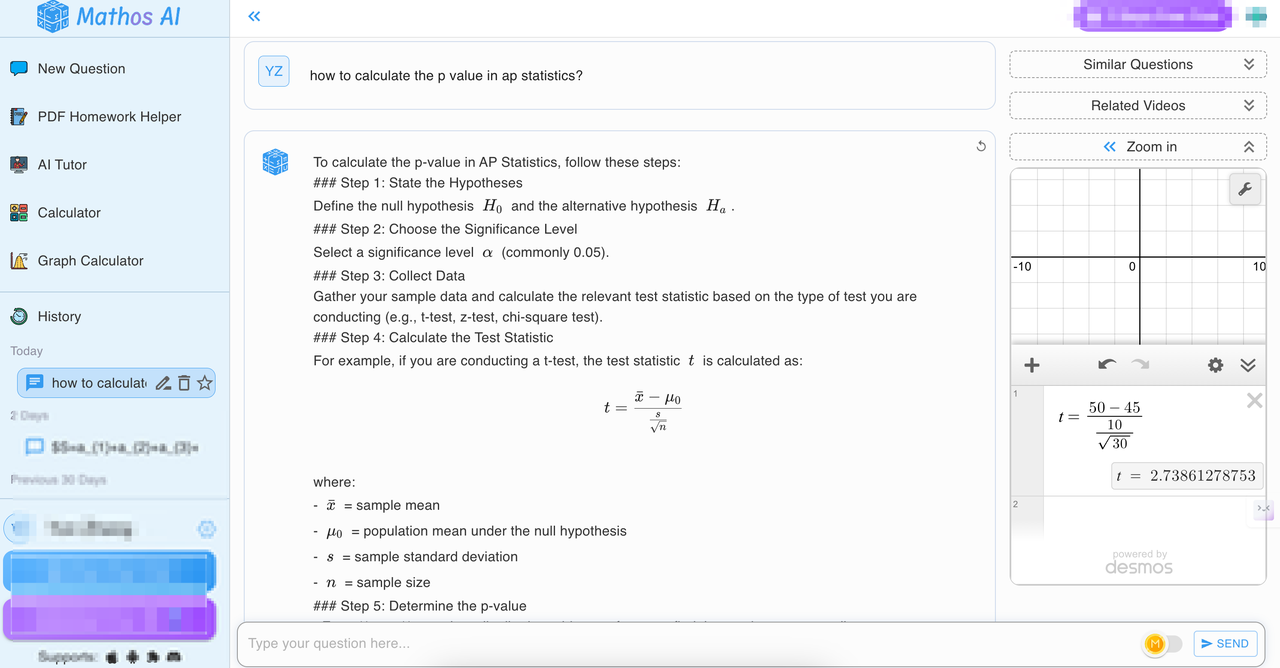
- Step 4: Use the test result to make conclusions (statistical inference). If the probability value is small (less than 0.05), it means the results are unlikely to be just random chance. So, you reject the idea that Mathos AI has no effect and conclude that it likely helps improve AP Statistics scores. If the probability value is large, it means there isn’t enough evidence to conclude that Mathos AI is more effective.
If you don't know how to calculate the p-value or probability value in the example now, no worries, you'll learn that in AP Statistics. Can't wait? Take a quick look at Mathos AI :)
This process allows you to use sample data (the test scores) to infer whether Mathos AI has a significant impact on improving AP Statistics performance for all students.
Now, if you want to get categorical data, you can use a chi-square test to find out whether Mathos AI affects student's learning preferences.
A chi-square test is a way to figure out if there’s a connection between two categories or if what you observe is just random. For example, let’s say you want to see if using Mathos AI affects how students prefer to study (like group study, solo study, or online resources). You’d collect data, compare what you actually see (observed data) to what you’d expect if there’s no relationship (expected data), and use the chi-square test to check if the difference is big enough to matter.
AP Statistics Exam
The AP Statistics exam is a three-hour test divided into two main sections: multiple-choice and free-response. Each section is worth 50% of the total score. You'll be provided with an AP Statistics formula sheet with key formulas for descriptive statistics, probability, distributions, sampling, confidence intervals, hypothesis testing, chi-square tests, and regression analysis to assist in solving statistical problems.
40 Multiple Choice Questions | 1 Hour 30 Minutes | 50% Exam Score
You'll find individual questions or sets of questions based on a shared prompt.
6 Free Response Questions | 1 Hour 30 Minutes | 50% Exam Score
Part A (5 Questions)
- Collecting Data: 1 multipart question focused on data collection.
- Exploring Data: 1 multipart question focused on analyzing and interpreting data.
- Probability and Sampling Distributions: 1 multipart question focused on these concepts.
- Inference: 1 question focused on statistical inference methods.
- Mixed Skills: 1 question combining two or more skill categories.
Part B (1 Question)
- Investigative Task: A single question that assesses multiple skills and content areas, emphasizing the application of knowledge in new or non-routine contexts.
AP Statistics Exam Questions
Example of AP Statistics exam multiple choice question:
A bank surveyed all of its 60 employees to determine the proportion who participate in volunteer activities. Which of the following statements is true?
(a) The bank should not use the data from this survey because this is an observational study.
(b) The bank can use the result of this survey to prove that working for the bank causes employees to participate in volunteer activities.
(c) The bank did not select a random sample of employees, so the survey will not provide the bank with useful information.
(d) The bank would have to use survey data to construct a confidence interval to estimate the proportion of employees who participate in volunteer activities.
(e) The bank does not need to use an inference procedure to determine the proportion of employees who participate in volunteer activities because the survey was a census of all employees.
Example of AP Statistics exam free response questions:
A local elementary school decided to sell bottles printed with the school district's logo as a fundraiser. The students in the elementary school were asked to sell bottles in three different sizes (small, medium, and large). The relative frequencies of the number of bottles sold for each size by the elementary school were 0.5 for small bottles, 0.3 for medium bottles, and 0.2 for large bottles.
A local middle school also decided to sell bottles as a fund-raiser, using the same three sizes (small, medium, and large). Middle school students sold three times the number of bottles that elementary school students sold. For middle school students, the proportion of bottles sold was equal for all three sizes.
(a) Complete the segmented bar graphs representing the relative frequencies of the number of bottles sold for each size by students at each school.

(b) An administrator at the elementary school concluded that the elementary school students sold more small bottles than the middle school students did. Is the elementary school administrator's conclusion correct? Explain your response.
Two high schools are also selling the bottles and are competing to see which one sold more large bottles.
(c) A mosaic plot for the distribution of the number of bottles sold by each of the high schools is shown here.
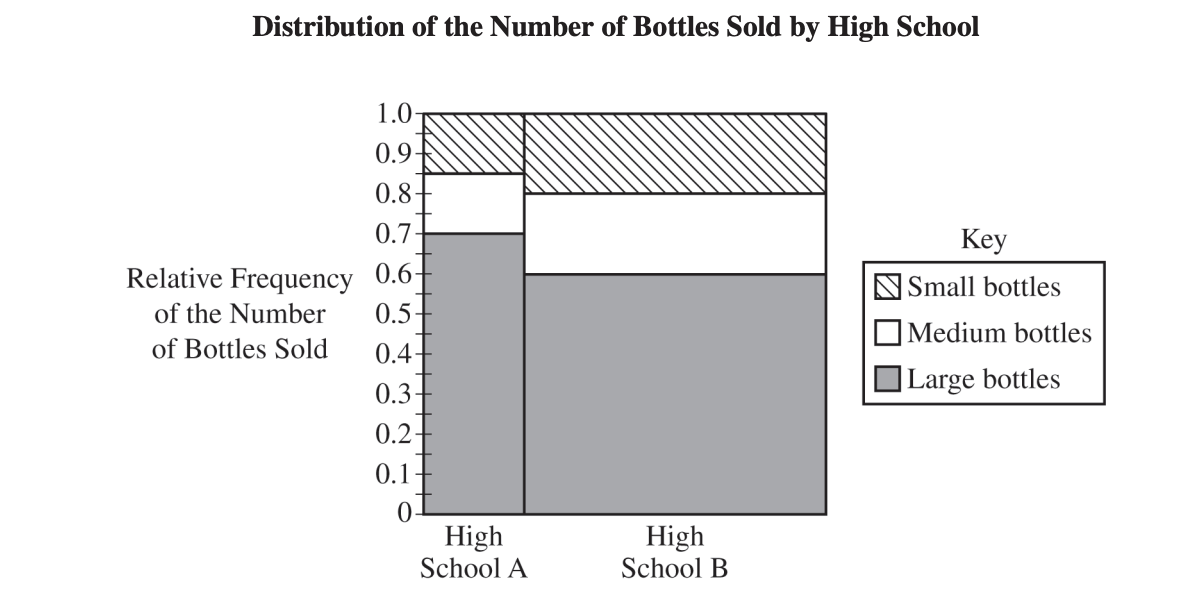
(i) Which of the two high schools sold a greater proportion of large bottles? Justify your answer.
(ii) Which of the two high schools sold a greater number of large bottles? Justify your answer.
Why Should You Take AP Statistics?
Taking AP Statistics can benefit you in several ways, both academically and practically. Here's why:
- Earn college credit and save money on college tuition.
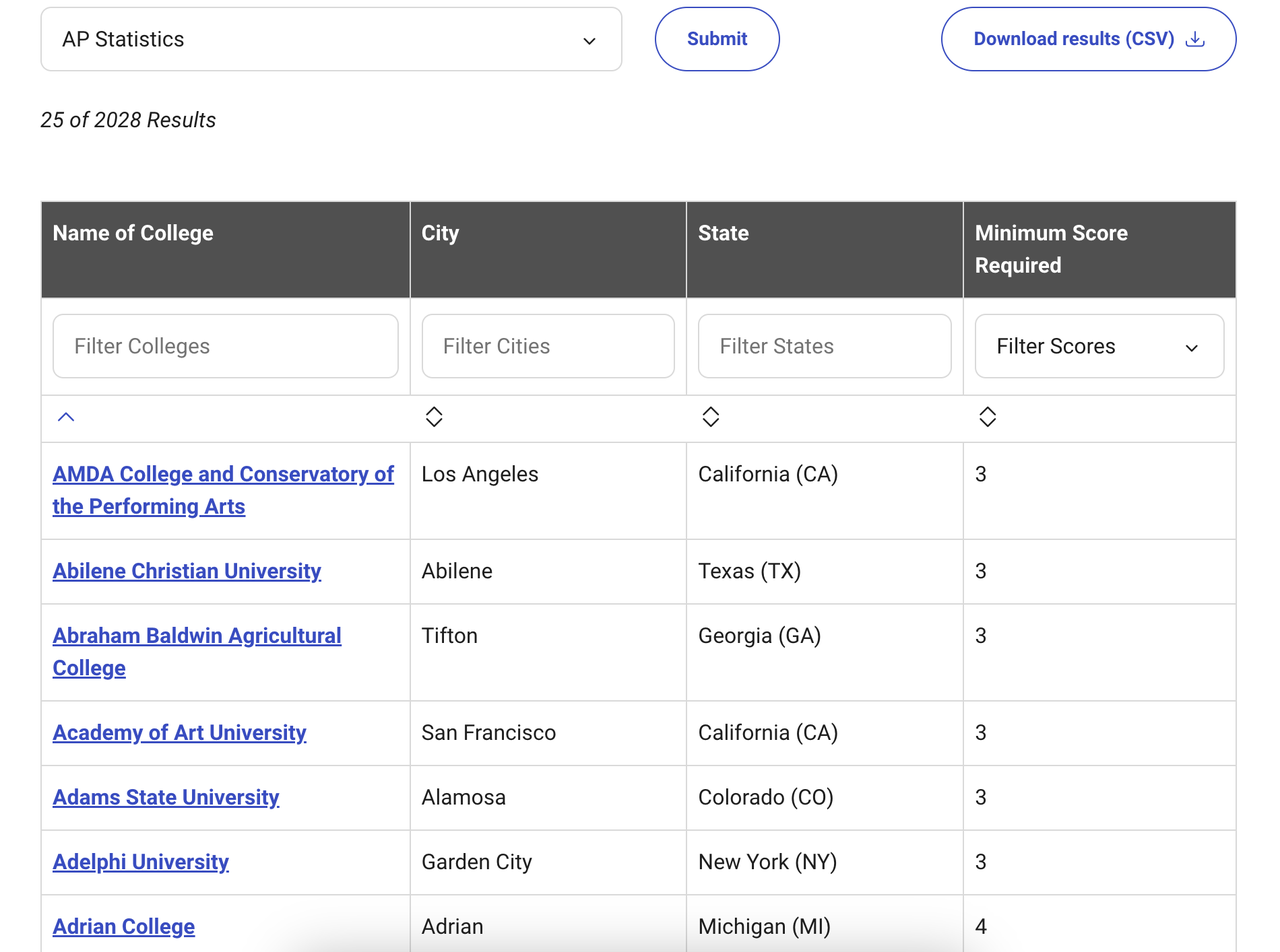
Many colleges offer credit for AP Statistics if you score well on the exam (usually a 3 or higher). This can allow you to skip introductory statistics courses in college, saving both time and tuition costs. If you want to know which college accepts AP credits, check the AP Policy of the college you apply for using the College Board's AP Credit Policy Search. Simply select the AP course, and you'll see a list of universities that give credit to the course and the minimum AP score required.
- Develop analytical skills for real-world applications.
AP Statistics teaches you how to collect, analyze, and interpret data, skills that are essential in our data-driven world. These skills are applicable across various fields like business, social sciences, engineering, and more. Building data analyzing skills can help you evaluate polls, understand research, or make data-driven decisions.
Imagine you’re working for a company that wants to know if a new advertising campaign increased sales. You can gather sales data from before and after the campaign, use statistical methods to compare stats and analyze the results to decide whether the campaign works, or needs to design a new one.
- Strengthen your college applications.
Taking challenging courses like AP Statistics demonstrates academic rigor and shows colleges that you're prepared for higher-level coursework. Admissions counselors often see AP classes as a sign of commitment to academics and readiness for college-level material.
I know, some of you might think: what happens if you don't get a high score on the AP exam? If you don’t score high on the AP exam, you won’t earn college credit, but it won’t hurt your GPA or college admissions significantly if you don’t report it.
- Prepare yourself for standardized tests.
AP Statistics helps prepare you for standardized tests like the SAT, ACT, and even graduate exams like the GRE by teaching essential skills such as data analysis, probability, and interpreting statistical results. These skills are directly applicable to sections of these exams, such as interpreting graphs and charts in the SAT/ACT or solving quantitative reasoning problems on the GRE.
By mastering AP Statistics, you'll gain a strong foundation in handling data-driven questions, which are common across these tests.
4 Tips to Success in AP Statistics
- Practice regularly
Practice the multiple-choice and free-response questions regularly. You don't have to do the full 3-hour test every time, but spend more time in your weak areas. One month before the exam, try to do the full exam once a week under timed conditions, which helps you manage time effectively and get comfortable with the exam structure.
You can find AP Statistics practice tests and past exams on the College Board, CrackAP, etc. You should look at the sample responses to get an idea of the format.
- Understand the formula sheet
It's important to memorize formulas, but it's more important to understand how and when to use them.
Let’s take the z-score formula as an example.
Instead of just memorizing it, know when to use it. Suppose a test has an average score of 80 with a standard deviation of 10, and you score 90. What’s your z-score?
Plug into the formula:
This means your score is 1 standard deviation above the mean. Understanding this helps you interpret results, not just crunch numbers.
- Use your calculator effectively
You can use a graphing calculator in both exam sections. Get comfortable with your graphing calculator for things like standard deviation, regression, and probability can save you time during the exam.
For example, if you want to record test scores: 78, 85, 90, 92, 88. Instead of manually using the formula:
You can enter the data into STAT → EDIT, then use STAT → CALC → 1-Var Stats to find the mean and standard deviation instantly.
- Take advantage of learning tools
AI learning tools like Mathos AI are game-changers for AP Statistics students. You can use Mathos AI to solve problems step-by-step, whether it’s calculating z-scores, interpreting confidence intervals, or running hypothesis tests. You can upload your homework or snap a picture of a question, and it’ll explain the solution. It’s like having a tutor available anytime you need it.
https://youtu.be/4twGM1J0Slw?si=5bABrVnxDbKNV2iy
Conclusion
AP Statistics is all about understanding and interpreting data. It's an AP math class not only for STEM majors, but it's essential in various fields like business, marketing, psychology, etc. Now to answer the question "Is AP Stats hard?" If you know how to study for it, it's totally manageable. Don’t just memorize formulas, know when and how to use them. Get comfortable with your calculator and focus on explaining concepts clearly. Master the basics, and you'll be set for the exam and beyond.
FAQs
What are the most challenging topics in the AP Statistics exam?
The most challenging topics in AP Statistics are hypothesis testing, especially with t-tests and chi-square tests, and regression analysis, particularly interpreting residuals and understanding the conditions for inference. These require a strong grasp of both calculations and concept application.
Is AP Statistics harder than AP Calculus?
No. AP Statistics is generally considered easier than AP Calculus because it focuses more on interpreting data and understanding concepts, while Calculus is more calculation-intensive and requires strong algebra skills. However, the difficulty depends on your strengths.
What is AP Statistics equivalent to?
AP Statistics is equivalent to a one-semester, introductory, non-calculus-based college statistics course. It typically aligns with courses like MATH 1342 (Statistics) or similar introductory statistics classes offered at colleges and universities, focusing on data collection, analysis, probability, and inference.
How hard is the AP Statistics exam?
The AP Statistics exam is considered moderately difficult compared to other AP exams, with a pass rate of around 62% (based on the result in 2024). While the concepts are more conceptual than computational, topics like probability, hypothesis testing, and sampling distributions can be challenging for students without strong critical thinking or math skills.